Analytics filtersmenu
Limits every chart on the page.
Series, Sets, Rarity, Foil Type, Condition, Favorites, Date Added, and Pricing Availability are visible. Menu contents were not opened.
Not fully verified in the capture.
 Scott's TCG Binder
Analytics summarizes composition and change in the collection.
Analytics summarizes composition and change in the collection.
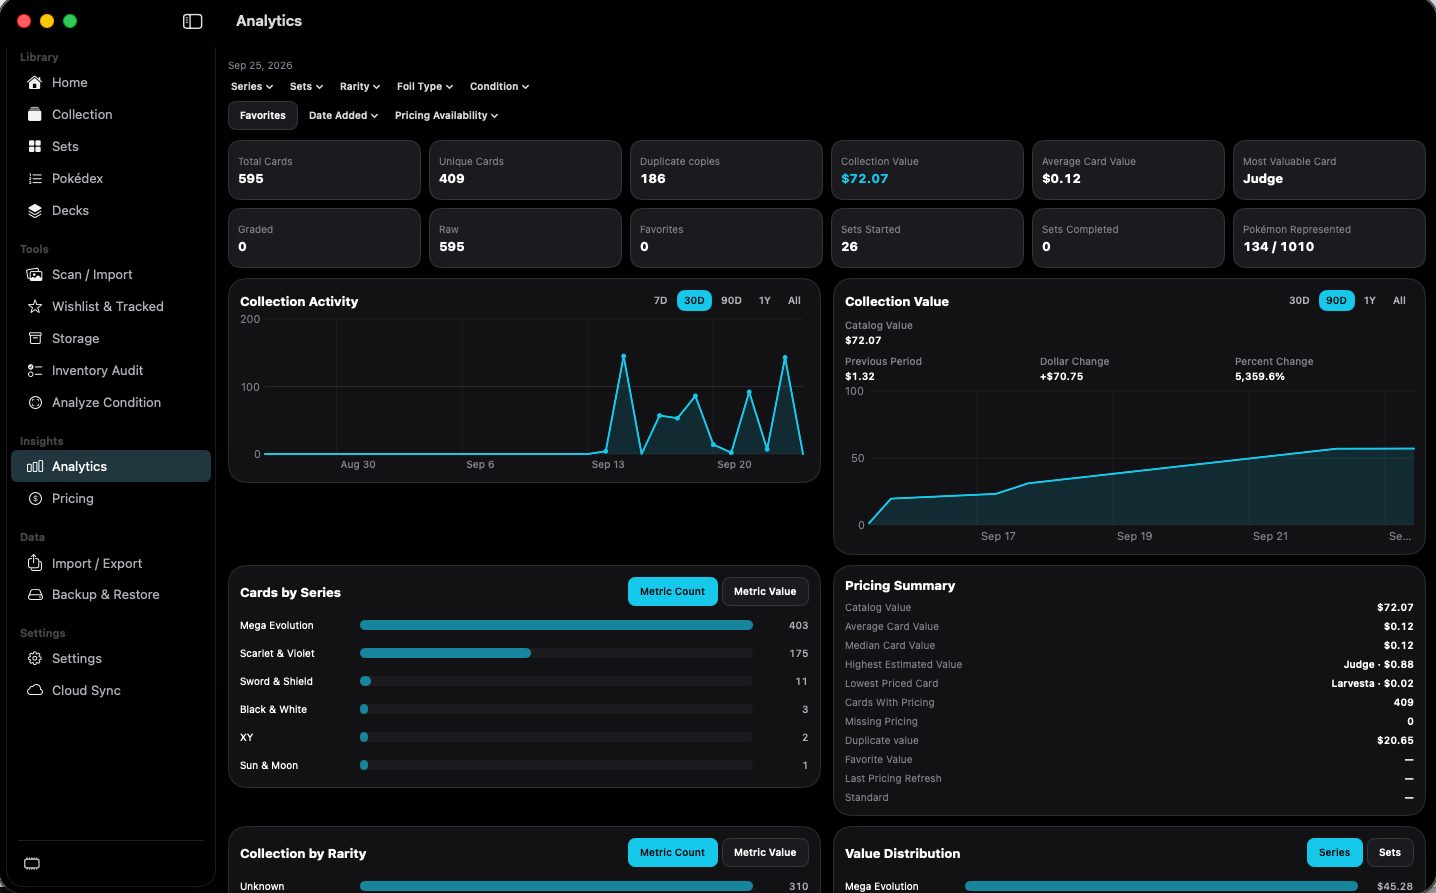
shot desktop-analytics · seq 17 · assets/screenshots/original/desktop/0017.png
Visual reference not yet available for this platform.
Visual reference not yet available for this platform.
Limits every chart on the page.
Series, Sets, Rarity, Foil Type, Condition, Favorites, Date Added, and Pricing Availability are visible. Menu contents were not opened.
Not fully verified in the capture.
Changes the time window for activity and value.
7D, 30D, 90D, 1Y, and All. Activity is on 30D and value is on 90D in the capture.
Switches a breakdown between number of cards and value.
Shown on Cards by Series and Collection by Rarity.
Watch the collection change, not just the latest total.